Topic: "plot"
SciQLop/SciQLopPlots
Language: C++ - Size: 3.4 MB - Last synced at: about 1 month ago - Pushed at: about 1 month ago - Stars: 2 - Forks: 3
openalea/scipack
Sientific Python wrappers for OpenAlea Visual Programming environment
Language: Python - Size: 18 MB - Last synced at: about 1 month ago - Pushed at: 7 months ago - Stars: 2 - Forks: 0
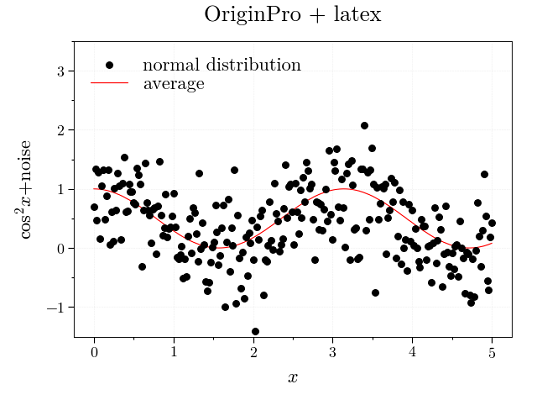
2010panniere/publib
Produce publication-level quality images on top of Matplotlib. Project hosted on GitHub : https://github.com/erwanp/publib
Last synced at: about 2 years ago - Pushed at: about 2 years ago - Stars: 1 - Forks: 0
bia/path-intensity-profil
Compute the intensity profile of ROI contour along Z (3D) and T (timelaps) dimension. Generates a workbook document containing all the intensity values for each point of the contour, can be plotted as graph or exported as CSV
Last synced at: almost 2 years ago - Pushed at: about 2 years ago - Stars: 0 - Forks: 0
oz-reuse/labview/ozr-RTChart
Module de code réutilisable pour LabVIEW.
Last synced at: almost 2 years ago - Stars: 0 - Forks: 0